plot-openssl-speed
Bash script to plot openssl speed results.
Project maintained by KazKobara Hosted on GitHub Pages — Theme by mattgraham
pairing_bench.sh: How to show pairing-benchmarking results easily
pairing_bench.sh measures the processing speed of bilinear maps, or pairings, supported in the following open-source repositories:
I chose them because they are active as of
pairing_bench.shv1.3 and have already supported or are expected to support more than 128-bit security.
Examples of measured results
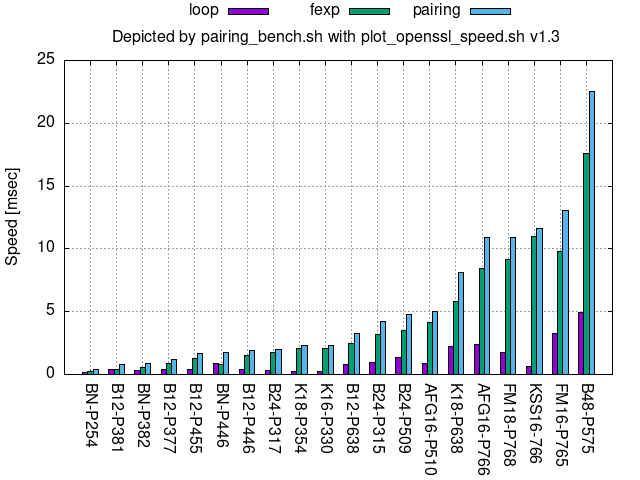
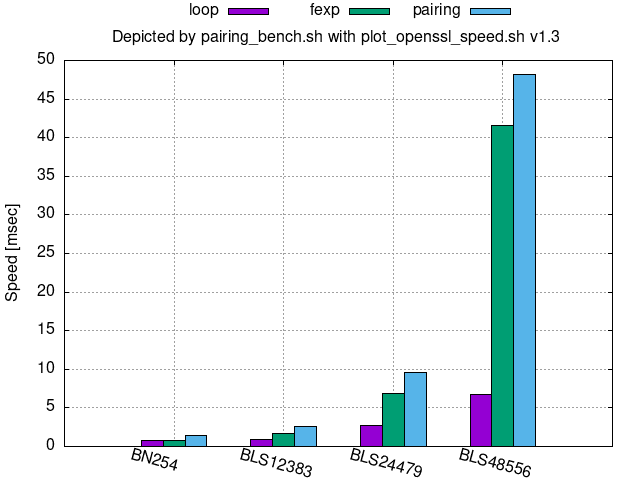
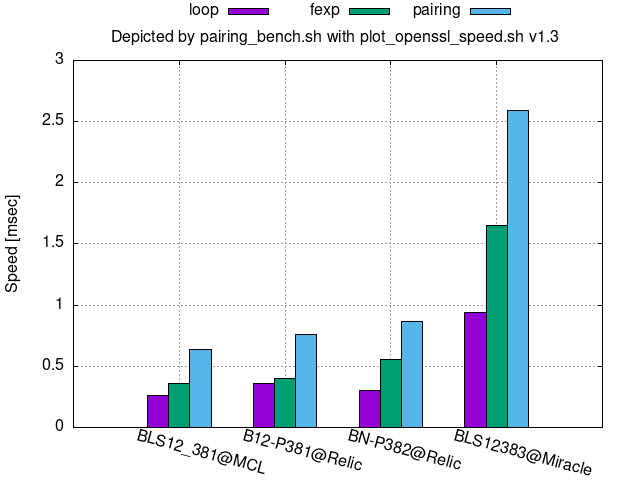
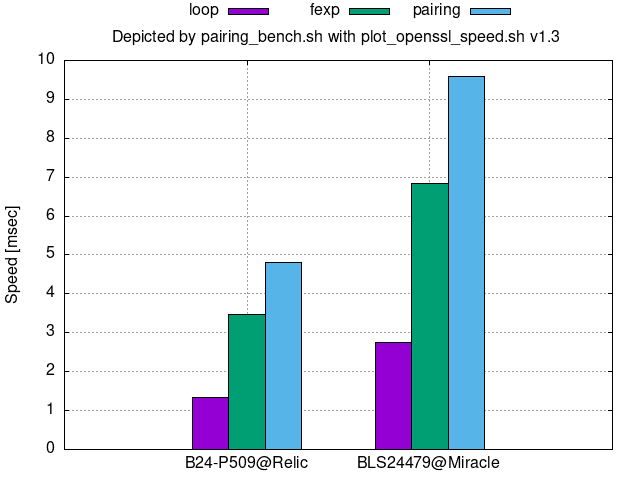
In the legend on the top of the following figures, loop denotes the core looping process of the bilinear map, fexp denotes final exponentiation, and pairing denotes loop+fexp.
Comparison per repository
Relic 0.7.0 (preset/x64-pbc-*.sh in the Relic 0.7.0 repository)
Miracle v4.1:
MCL 3.04:
Cf. the figure of 128-bit security below.
Comparison per bit security
128-bit security:
For 128-bit security, the results in [eccbench21] are useful as well.
192-bit security:
Annex D.3.4 of [ISO/IEC 15946-5:2022] gives parameters corresponding to B24-P559, BLS24559, or BLS24_559.
256-bit security:
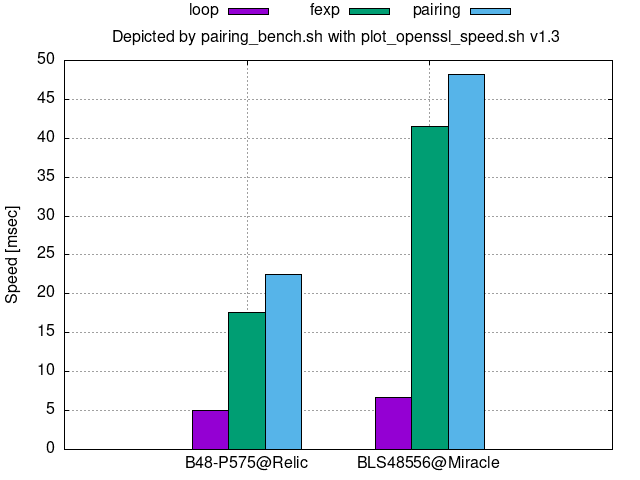
Annex D.3.5 of [ISO/IEC 15946-5:2022] gives parameters corresponding to B48-P581, BLS48581, or BLS48_581.
How to measure and depict them
- Install necessary commands:
-
On Debian/Ubuntu:
sudo apt install gnuplot git make gcc pythonmakeandgccare to make binaries in each repository.pythonis to configure test in Miracle.
-
On macOS:
-
Install Command Line Tools
Follow the instruction after entering a command that Command Line Tools provide like:
gcc -
Install Homebrew, then
brew install gnuplot coreutils python gsedcoreutilsis needed to userealpathcommand.pythonis to configure test in Miracle Core.
-
-
-
Download and enter this repository:
git clone https://github.com/KazKobara/plot_openssl_speed.git cd plot_openssl_speed -
Help and usage:
./pairing_bench.sh -h -
Command
The following example command saves measurement raw results, their tailored data, and their figures in the
./tmp/Pairing/folder as*.log,*.dat, and*.png, respectively../pairing_bench.sh mcl:v3.04 relic:0.7.0 miracle:v4.1- The part before
:in each argument is the alias of the repository supported in this script. - The part after
:specifies either a branch name or a tag name for that repository. - For x86-based CPUs,
-t tsc(Time Stamp Counter) option measures CPU cycles using RDTCS/RDTCSP instructions, instead of real time. - For non-x86-based CPUs, you may need to modify
pairing_bensh.shand other files according to the instructions in the repository:- For Relic 0.7.0, change
x64-pbc-*.shundertmp/Pairing/Relic/relic-0.7.0/presetand adjustpairing_bensh.shfor your CPU.
- For Relic 0.7.0, change
- The part before
Computational Environment
I measured and depicted the above figures in the following environment:
WSL2 Ubuntu
$ awk '/^PRETTY/ {print substr($0,14,length($0)-14)}' /etc/os-release

Ubuntu 22.04.5 LTS
$ uname -srm

Linux 6.6.87.2-microsoft-standard-WSL2 x86_64
$ awk '{if($1$2 == "modelname"){$1="";$2="";$3=""; model=substr($0,4)}; if($1$2 == "cpuMHz") {max=$4/1000; printf "%s (%.2fGHz)\n",model,max; exit;}}' /proc/cpuinfo

Intel(R) Core(TM) i7-10810U CPU @ 1.10GHz (1.61GHz)
Link
- [Relic] “Relic Toolkit,” https://github.com/relic-toolkit/relic
- [Miracle] “The MIRACL Core Cryptographic Library,” https://github.com/miracl/core
- [MCL] “A portable and fast pairing-based cryptography library,” https://github.com/herumi/mcl
- [eccbench21] “Benchmarking pairing-friendly elliptic curves libraries,” https://hackmd.io/@gnark/eccbench
- [ISO/IEC 15946-5:2022] “Cryptographic techniques based on elliptic curves - Part 5: Elliptic curve generation,” 2022